S&P500 Daily Action Areas & Price Targets 27/7/26

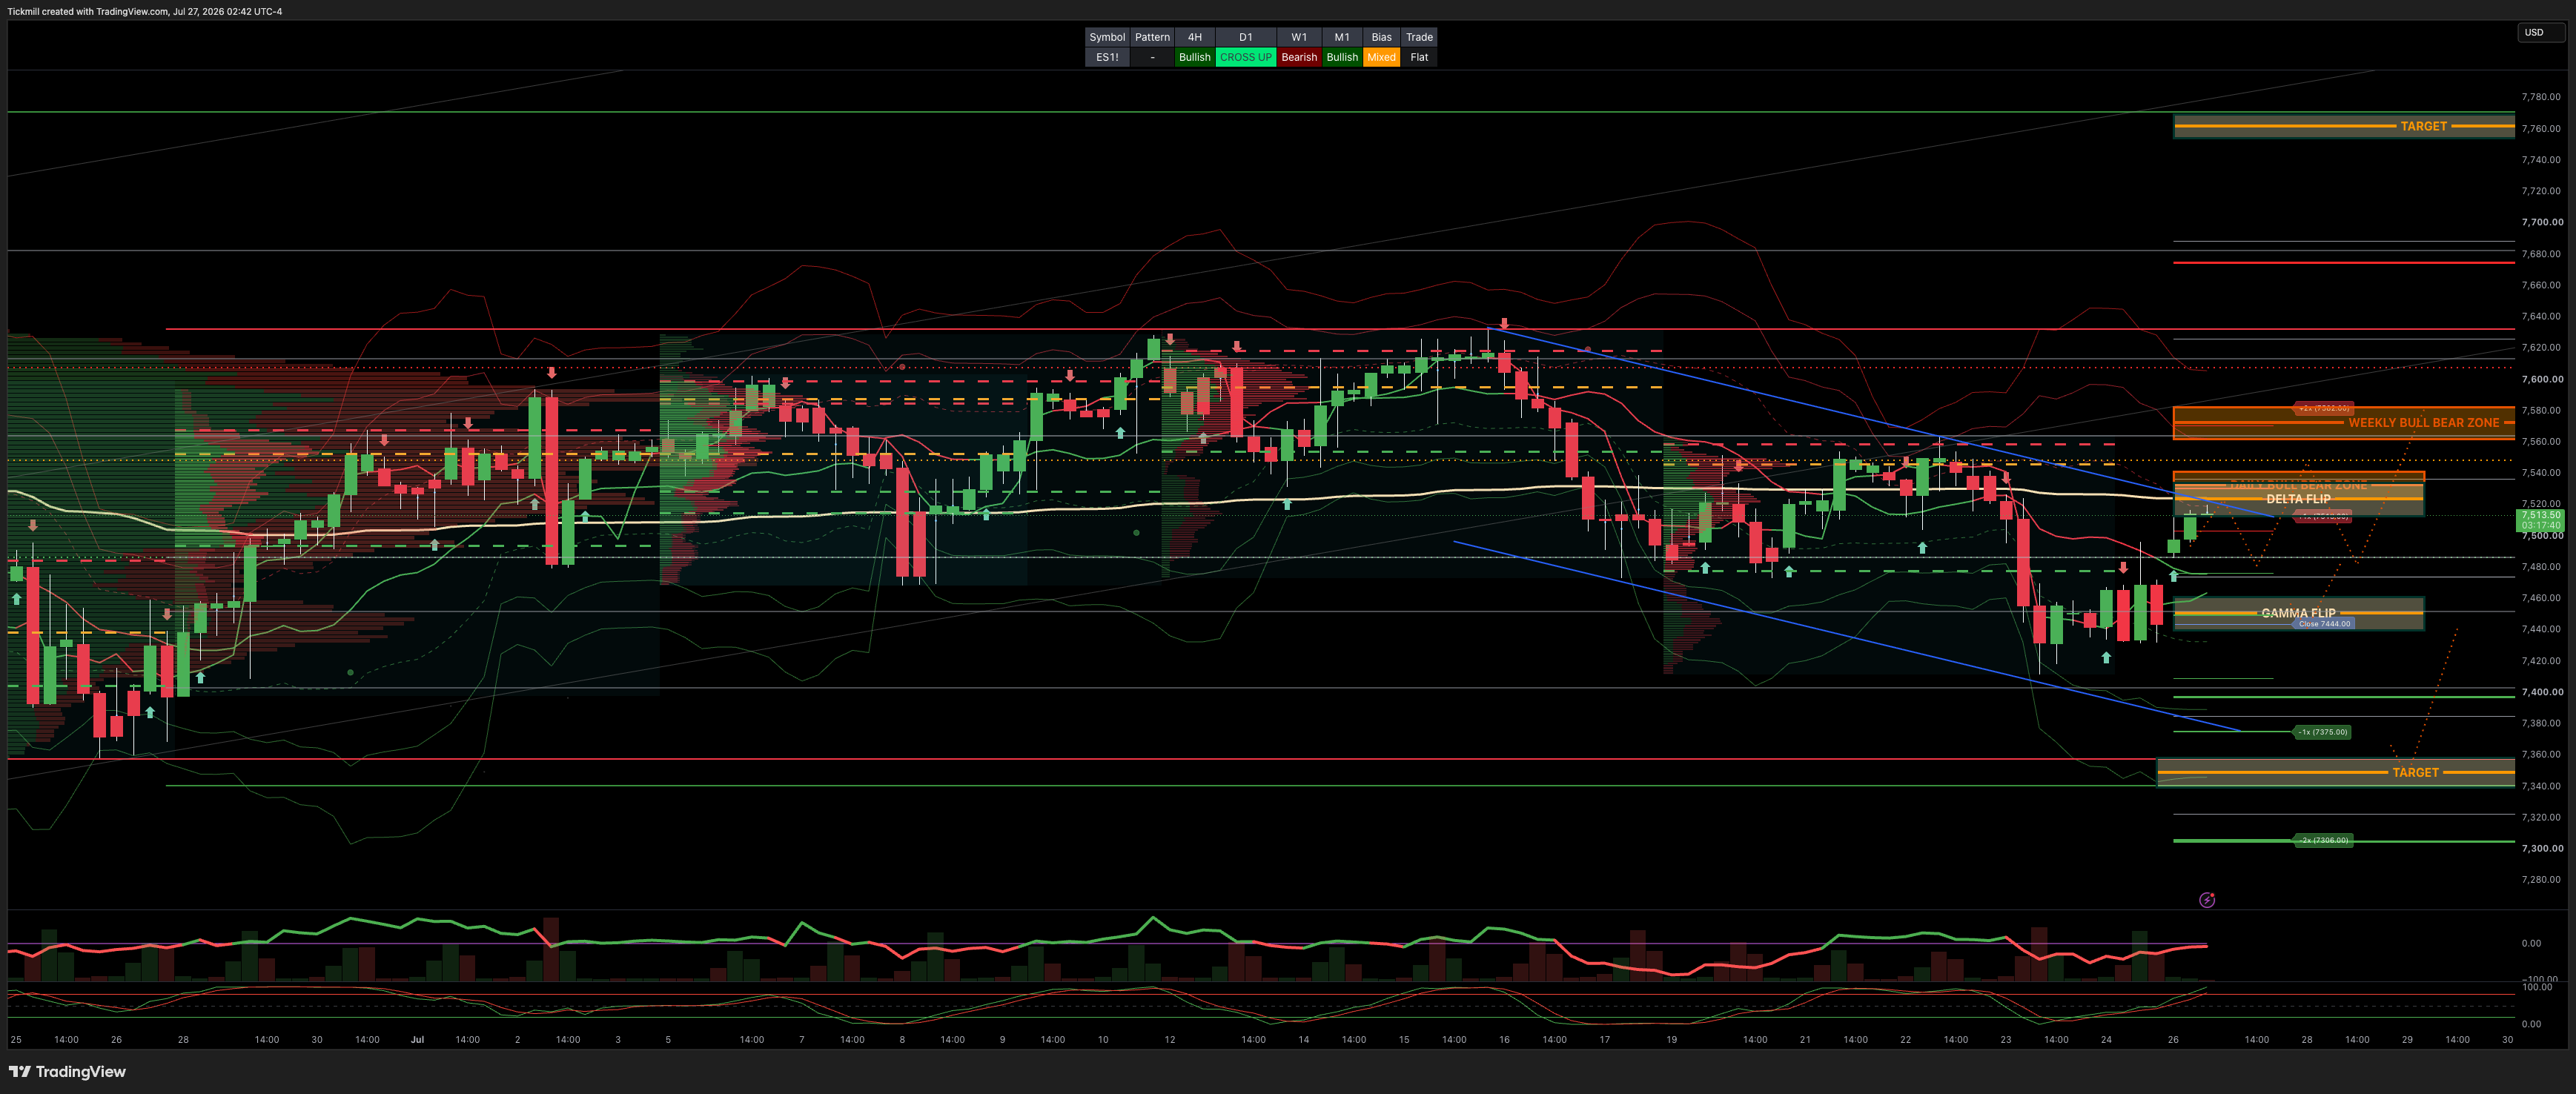
S&P500 Daily Action Areas & Price Targets 27/7/26
***QUOTING ES1! FOR CASH US500 EQUIVALENT LEVELS, SUBTRACT POINT DIFFERENCE***
WEEKLY BULL BEAR ZONE 7560/80
WEEKLY RANGE RES 7602 SUP 7301
MONTHLY RANGE RES 7838 SUP 7258
JHEQX Q3 Collar Short Call Cap: ~7,750 – 7,900 - Long Put Strike: ~7,050 – 7,100 (approx. 5% downside protection) Short Put Strike: ~5,950
DEC2025 OPEX to DEC2026 OPEX is 945 points giving us a range of [5889,7779]
SPX PUT/CALL RATIO 1.18 (The numbers reflect options traded during the current session.) A put-call ratio below 0.7 is generally considered bullish, and a put-call ratio above 1.0 is generally considered bearish.
GS Flow Desk: large S&P 31Aug 7000/7950 strangle in roughly $20mm vega / $115mm premium …My Read – classic “big convexity versus carry” trade: either someone paid a lot to own a wide August move, or someone got paid a lot to bet that the S&P stays comfortably inside the 7000–7950 corridor
DAILY VWAP BULLISH 7485
WEEKLY VWAP BEARISH 7522
MONTHLY VWAP BULLISH 7036
DAILY STRUCTURE - TBC
WEEKLY STRUCTURE - BALANCE 7648/7247
MONTHLY STRUCTURE - OTFH - 7247
Balance: This refers to a market condition where prices move within a defined range, reflecting uncertainty as participants await further market-generated information. Our approach to balance includes favouring fade trades at the range extremes (highs/lows) while preparing for potential breakout scenarios if the balance shifts.
One-Time Framing Higher (OTFH): This represents a market trend where each successive bar forms a higher low, signalling a strong and consistent upward movement.
One-Time Framing Lower (OTFL): This describes a market trend where each successive bar forms a lower high, indicating a pronounced and steady downward movement.
DAILY BULL BEAR ZONE 7525/40
GAMMA FLIP 7450
DELTA FLIP 7526
DAILY RANGE RES 7512 SUP 7376
2 SIGMA RES 7580 SUP 7308
VIX BULL BEAR ZONE 17.9
TRADES & TARGETS
SHORT ON REJECT/RECLAIM DAILY/WEEKLY BULL BEAR ZONE TARGET CLOSE
***ADDITIONAL SETUPS & TARGETS HIGHLIGHTED ON THE CHARTS***
(I FADE TESTS OF 2 SIGMA LEVELS ESPECIALLY INTO THE FINAL HOUR OF THE NY CASH SESSION AS 90% OF THE TIME WHEN TESTED THE MARKET WILL CLOSE ABOVE OR BELOW THESE LEVELS)
GOLDMAN SACHS FICC & EQUITY TRADING DESK VIEWS
US Equities Weekly Setup — Index Vol Finally Wakes Up to the Vol Under the Surface
US equity indices are finally starting to acknowledge the significant volatility that has lived beneath the surface for weeks. For much of July, the dominant market feature was extreme dispersion: average stock vol and factor vol were elevated, but SPX index vol remained muted because correlation stayed exceptionally low and rotation absorbed the damage. That is beginning to change.
Some metrics of average stock vol remain near highs, but broader index-vol indicators are no longer ignoring idiosyncratic stress. The clearest example is SPX skew versus ATM implied vol: downside demand is starting to build at the index level after months of “premium fatigue.” The market is moving from a regime of “single-name chaos, index calm” toward a regime where index vol may finally catch up.
This week has two main catalysts: earnings and the Fed.
1. Earnings — The AI Capex Debate Moves From Growth to ROIC
This is a massive earnings week, with 34% of S&P 500 market cap reporting. The S&P is pricing a 1.7% implied move through Friday PM, which is meaningful given how much macro and micro risk is stacked into the calendar.
The focus is on the tech spenders — the hyperscalers and mega-cap tech names that are now increasingly asset-heavy companies. Investors want answers on two issues:
Return on invested capital
Future capital expenditure plans
AI capex has been rocket fuel for markets, semis, power, data-center infrastructure, and AI enablers. But investors are starting to push back. The debate is shifting from “how big can capex get?” to “what is the return on that capex, who monetizes it, and when?”
That is a very different question for equity holders.
The Stress Sequence
The stress has followed a logical path:
Credit moved first in the hyperscaler basket.
CDS spreads moved second.
Hyperscaler single-name implied vols moved third.
NDX implied vol moved fourth.
SPX implied vol may be next.
This is the key sequencing. The market first questioned balance-sheet / credit implications, then single-name equity vol, then index-adjacent tech vol, and now potentially broader SPX vol.
That is exactly what you would expect if a formerly idiosyncratic / sector-specific concern is beginning to migrate into broader index risk.
Key Tech Earnings This Week
The main reports:
MSFT
META
QCOM
ARM
AAPL
AMZN
The market will be watching not just results, but capex guides versus market reaction. The key question: does the “beat and fade” pattern continue?
This is important because recent tech / AI prints have not stabilized the tape. ASML, TSM, TXN, GOOGL, MXL, INTC, and BE Semi all traded lower on beats / raises over the last two weeks. If MSFT / META / AAPL / AMZN also beat and fade, the market will likely conclude that earnings quality is not enough to overcome macro tightening, AI ROIC concerns, and still-fragile positioning.
2. Fed — Rarely This Much Uncertainty Into a Meeting
This will be one of the first Fed meetings in years where the market does not have at least 80% confidence in what the committee will do. As of Friday, markets were pricing roughly 40% odds of a hike. If that pricing holds, this could be the largest “non-cut” surprise in decades.
The prior Fed chair made a practice of clearly signaling intentions to the market. The new Fed leader is on record as being largely against that practice. That matters because the market may not get the same “guided landing” into the decision.
The FOMC “excess variance” chart has been moving tick-for-tick with hike odds. Translation: uncertainty around the Fed decision is now directly feeding event vol.
Hawkish Hold Risk
A hawkish hold is a very plausible outcome. The Fed can point to recent soft CPI / PPI as justification for no immediate hike, while also emphasizing that crude, rates, and inflation expectations require vigilance.
But there is a risk that a hawkish hold is not enough. If crude stays bid and rates vol keeps rising, the market may treat no hike as the Fed falling behind the curve. That would keep alive the left-tail risk of more aggressive over-hiking later.
This is why the Fed matters for equities: not because the level of rates alone is decisive, but because rate vol is the transmission channel into all risk assets.
3. Positioning — Nobody Is Taking a Big Swing Into EPS
Prime data show the US equity book was only marginally net bought, roughly +0.1 standard deviations, as investors keep books tight into earnings.
US fundamental long/short positioning remains subdued:
Metric | Latest | Percentile |
|---|---|---|
Gross exposure | 204.2 | 6th percentile |
Net exposure | 51.7 | 22nd percentile |
Those are not the statistics of a market taking a major swing into earnings season. Gross exposure in the 6th percentile shows risk appetite remains extremely constrained. Net exposure in the 22nd percentile is low but not washed out.
This cuts both ways:
Low gross reduces forced-selling risk.
Low gross also means managers are not confident enough to press longs.
If earnings work, underexposure creates chase risk.
If earnings fail, low conviction can quickly turn into further de-risking.
4. Cash Desk vs. Prime — “Risk Off” Felt Worse Than PB Data
There is a disconnect between high-level PB data and cash desk feel. Prime suggests small net buying, but the trading desk felt very risk-off into the weekend.
The pain points were clear:
Momentum under pressure
Semis under pressure
AI under pressure
Low momentum / short pockets squeezing
Little appetite to defend tech
That type of tape is psychologically damaging even if aggregate flow data look benign. It creates performance frustration, reduces willingness to add risk, and increases demand for hedges.
“July has been a long year” captures the mood well.
5. CTAs — Short-Term Thresholds Breached, Medium-Term Levels Matter More
The CTA community has been quiet for months, but it may become relevant again. The market is now below the short-term thresholds in major US equity indices, including SPX, NDX, and RTY.
CTAs are currently long roughly US$120bn of global equities, around the 49th percentile. That is not extreme, but it is enough to matter if signals begin to flip.
The medium-term thresholds are more consequential and sit below Friday’s close by:
Index | Medium-Term CTA Threshold Distance |
|---|---|
SPX | 2.9% below |
NDX | 2.0% below |
RTY | 5.4% below |
The most vulnerable is NDX, with its medium-term threshold only 2.0% below Friday’s close. Given tech volatility and this week’s earnings stack, that level is very much in play.
If medium-term CTA signals flip, the de-risking impulse could become more mechanical, especially into thin August liquidity.
6. Derivatives — Premium Fatigue Is Starting to Break
For months, there has been index-level premium fatigue. Clients were reluctant to pay for SPX / QQQ hedges because index vol kept failing to realize despite massive single-name and factor moves.
That started to change this week. Clients bought:
VIX call spreads
SMH put spreads
IWM downside
This is an important behavioral shift. The market is no longer assuming that dispersion will stay contained forever. Investors are beginning to hedge the possibility that semis / AI weakness spills into broader index vol.
Small Caps vs. Large Caps Vol Inversion
One of the more unusual market phenomena: small caps are acting like large caps, while large caps are acting like small caps. Over the last month, the Nasdaq has been 2.2x as volatile as the Russell 2000.
That is extraordinary. Normally, small caps carry more volatility because of weaker balance sheets, lower liquidity, and higher cyclicality. But in this regime, mega-cap tech / hyperscaler / AI concentration is the real volatility engine.
This reinforces the point that the market’s risk is no longer “small-cap beta.” It is mega-cap capex, AI ROI, and concentration risk.
7. Correlation / Dispersion — Still the Core Vol Debate
The second most discussed topic on the desk, after hyperscalers, is correlation and dispersion.
Implied correlation has come slightly off all-time lows, but remains exceptionally low:
Tenor | ATMF Implied Correlation |
|---|---|
3m | 13% |
12m | 17.5% |
Low implied correlation has allowed SPX index vol to stay subdued while single-name vol remains elevated. But the risk is that correlation normalizes higher. If it does, the short-index-vol leg of dispersion trades becomes vulnerable, forcing index vol higher.
This is especially relevant for convertible strategies and dispersion books. If you are running long single-name vol / short index vol, the tail risk is a correlation-1 move where the index short-vol leg suddenly dominates.
8. Momentum — Later Innings, But Vol Still Eye-Watering
The basket team continues to believe the momentum meltdown is in the later innings and thinks it is reasonable to add exposure given the high correlation between AI and the momentum trade.
But this is not a low-vol entry point. Realized volatility of the momentum pair is extremely high:
Window | Realized Vol |
|---|---|
5-day | 115 vol |
10-day | 91 vol |
30-day | 84 vol |
Those are eye-watering numbers. The “later innings” call is not the same as saying the trade is safe. It means positioning has cleaned up enough that the risk/reward is improving, but sizing must account for very high realized volatility.
9. Hyperscaler Rebound Trade — Long HYPR vs. NDX Outperformance
The custom basket team still likes playing for a rebound in hyperscalers, but outright vol is extremely high. One way to position for a rebound while selling implied correlation is through an outperformance option.
Suggested structure:
Buy the Sep26 100% strike GSXUHYPR > NDX outperformance call for 5.6%
The 105% strike costs 3.5%
If made contingent on NDX being up at expiry, premium is almost cut in half:
ATM outperformance around 3.0%
105% outperformance around 1.7%
This trade effectively calls a bottom in hyperscalers both:
In absolute terms
Relative to NDX
It is a cleaner expression than outright calls because it monetizes the view that hyperscalers rebound relative to the broader tech index, while also taking advantage of elevated vol / low implied correlation.
The risk is obvious: if hyperscalers remain the funding short in the AI trade, the outperformance does not work even if AI enablers do.
10. Futures / Funding — Cheaper Leverage Matters
The cost of funding S&P 500 leverage has come in significantly. This matters because there is a strong correlation between equity funding rates and leveraged ETF AUM.
Lower funding costs can support leveraged equity demand at the margin. But this should be treated as a secondary tailwind, not the dominant driver. In the current tape, earnings, Fed, crude, rates vol, and CTA levels are more important.
11. Sector Setup
TMT
This is a defining week for tech earnings:
MSFT
META
QCOM
ARM
AAPL
AMZN
The focus is capex guidance versus price reaction. The key question remains: will beat-and-fade continue?
If mega-cap tech beats and fades, the market may start to treat AI capex as a liability rather than a growth asset.
Consumer
Sentiment is cooling as rates and energy rally. Higher gasoline and higher discount rates pressure both margins and multiples. Still, the desk is positive on prints into next week:
HLT
KO
CAKE
MDLZ
CMG
SBUX
The consumer setup is likely stock-specific: strong brands and pricing power can work, but the sector-level macro is less friendly.
Energy
Hedge funds have bought the sector for six straight weeks, leaving the community net overweight Energy versus the Russell 3000 for one of the first times in five years.
Refining prints come next week. The sector specialist is looking to fade YTD outperformance, even though prints are expected to be strong. This is a positioning / expectations call more than a fundamental bear call.
Tactical Trading Framework
Into This Week
The setup is catalyst-heavy and fragile:
34% of SPX market cap reports
Fed uncertainty is unusually high
40% hike odds
SPX implied move 1.7%
NDX vol is elevated
SPX vol may be next
Short-term CTA thresholds already breached
Medium-term CTA thresholds are close, especially NDX
Clients are finally buying index / sector downside
Preferred Expressions
1. Relative value over outright beta
Favor:
Long hyperscaler rebound vs. NDX via outperformance options
Long AI enablers selectively versus hyperscalers only where capex benefits are clear
Long healthcare / select defensives
Avoid indiscriminate tech beta
2. Own convexity into Fed / earnings
Favor:
VIX call spreads
SMH put spreads
IWM downside
QQQ / SPX downside around event risk
3. Stay flexible on momentum
Momentum may be in the later innings of the unwind, but realized vol is extreme. Add exposure only with disciplined sizing or options-defined risk.
4. Watch for SPX vol catch-up
If SPX implied vol follows credit, CDS, hyperscaler vol, and NDX vol, index hedges will become more expensive quickly.
Disclaimer: The material provided is for information purposes only and should not be considered as investment advice. The views, information, or opinions expressed in the text belong solely to the author, and not to the author’s employer, organization, committee or other group or individual or company.
Past performance is not indicative of future results.
High Risk Warning: CFDs are complex instruments and come with a high risk of losing money rapidly due to leverage. 68% and 74% of retail investor accounts lose money when trading CFDs with Tickmill UK Ltd and Tickmill Europe Ltd respectively. You should consider whether you understand how CFDs work and whether you can afford to take the high risk of losing your money.
Futures and Options: Trading futures and options on margin carries a high degree of risk and may result in losses exceeding your initial investment. These products are not suitable for all investors. Ensure you fully understand the risks and take appropriate care to manage your risk.
Patrick has been involved in the financial markets for well over a decade as a self-educated professional trader and money manager. Flitting between the roles of market commentator, analyst and mentor, Patrick has improved the technical skills and psychological stance of literally hundreds of traders – coaching them to become savvy market operators!