Institutional Insights: BofA 'Nasdaq Pressure Brings Broader Unwind'

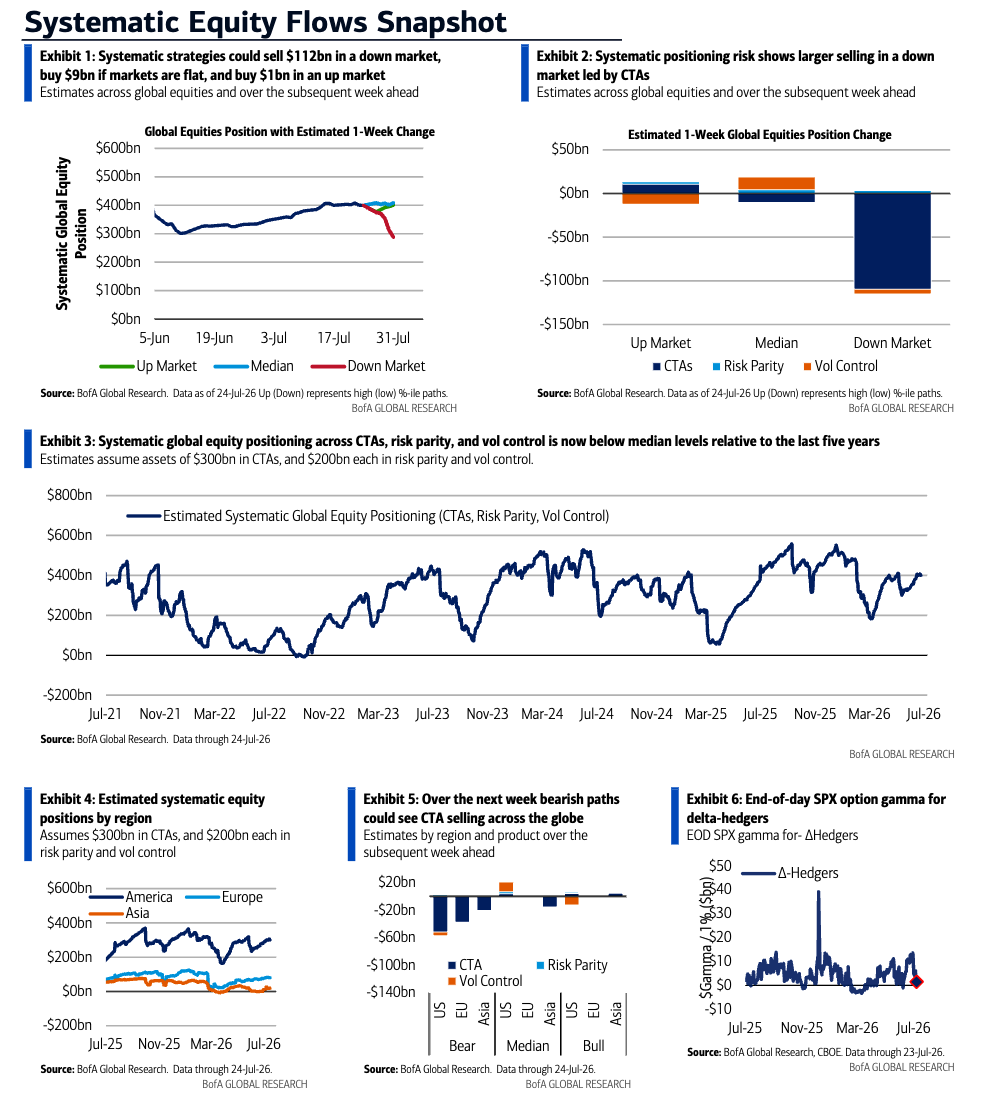
CTA / Gamma Update — Nasdaq Pressure Pushes First Wave of Equity Trend Unwinds Into Motion
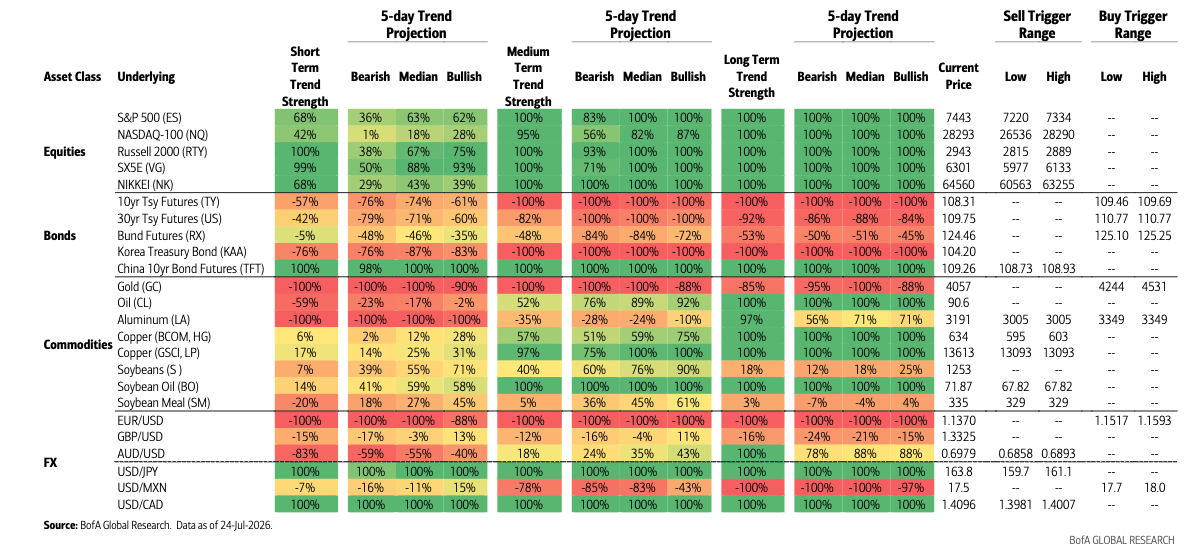
The latest CTA and gamma setup points to a market where the first mechanical stress is beginning to show, but broader forced deleveraging has not yet fully arrived. Nasdaq weakness on Thursday / Friday appears to have pushed the most aggressive CTA models into unwind territory, while faster models likely reduced exposure as short-term trends deteriorated. However, slower models remain more resilient, and positioning across broader equity indices still looks largely intact.
The key risk for the coming week is contagion: if Nasdaq pressure persists and spills into the S&P 500, Russell 2000, EURO STOXX 50, and Asian equity indices, CTA supply could broaden from a Nasdaq-specific unwind into a cross-index equity de-risking event.
At the same time, CTAs remain heavily aligned with the macro trend: short Treasuries, long USD, long oil, and increasingly short gold. That creates a market where systematic flows are pro-cyclical to the current macro shock: higher yields, stronger dollar, higher oil, lower gold, and weaker long-duration equities.
1. Equity CTAs — Nasdaq First, Broader Indices Still Holding
Entering the week, CTA equity longs were close to stop-loss levels but had not broadly flipped. Nasdaq’s Thursday / Friday decline appears to have changed that for the fastest models.
The likely sequence:
Most aggressive stop-loss models already unwound.
Faster-moving models likely de-risked.
Slower models with wider stop-loss bands remain long.
Broader equity positioning outside Nasdaq remains largely intact.
This is important because it means the first wave of systematic selling has likely started, but the larger wave still depends on whether weakness spreads.
Current Equity CTA Vulnerability
Market | CTA Status | Risk |
|---|---|---|
Nasdaq / NDX | First unwind wave likely triggered | Highest near-term risk |
Asian equities | Closely following Nasdaq; faster models likely reducing | Elevated |
S&P 500 | Positioning largely intact | Spillover risk |
Russell 2000 | Positioning largely intact | Lower but rising |
EURO STOXX 50 | Positioning largely intact | Spillover risk |
Nasdaq remains the leading edge because it is most exposed to the AI / hyperscaler / long-duration growth unwind. Asian equities are following more closely because of semiconductor / hardware / export exposure.
The S&P 500 is more insulated for now, but only if mega-cap tech weakness does not accelerate and sector rotation continues to cushion the index.
2. Key Equity Risk Next Week: Nasdaq Spillover
The main risk next week is that continued Nasdaq pressure spills into broader equities and triggers CTA unwinds across other major indices.
This would change the tape from:
Tech-led de-risking with rotation
to:
Cross-index systematic selling
That distinction matters. In the first regime, healthcare, defensives, energy, and low-momentum shorts can outperform while index drawdowns are manageable. In the second regime, correlations rise, index vol catches up, and even favored sectors can be sold as part of mechanical beta reduction.
The trigger would likely be a combination of:
Another weak reaction to mega-cap tech earnings
Higher yields
Hawkish Fed / hawkish hold
Oil staying bid
NDX medium-term CTA thresholds breaking
SPX moving closer to medium-term thresholds
Rising index volatility and correlation
3. Treasury CTAs — Shorts Grow as Yields March Higher
US yields continued to move higher across the Treasury curve, leaving trend followers well-positioned given their broadly short futures exposure.
The CTA Treasury positioning profile appears to be:
Curve Segment | CTA Positioning |
|---|---|
Front end | Likely near max short |
Intermediate tenors | Faster / medium models still have room to add shorts |
Long end | Shorts likely increased, but not necessarily maxed |
With yields near local highs, near-term unwind risk remains limited because trend signals still support short Treasury positions. However, the size of the short matters. If yields eventually reverse lower, the short-covering impulse could become significant.
In other words:
Current trend: CTAs continue to support higher yields.
Future risk: if yields fall, CTA Treasury short covering could accelerate the rally in bonds.
That matters for equities because a rates reversal could relieve pressure on long-duration tech, but a disorderly unwind in rates positions could also increase cross-asset volatility.
4. FX CTAs — Long USD Consensus
In FX, CTAs appear to hold consensus shorts in:
EUR
JPY
CAD
against long USD.
This aligns with the broader macro backdrop: higher US yields, Fed uncertainty, geopolitical stress, and oil volatility have supported the dollar. The long USD position is also a headwind for gold and non-US risk assets.
The risk is that if the Fed delivers less hawkishly than expected or US data soften, the USD long could become vulnerable to a reversal. But for now, trend followers remain aligned with dollar strength.
5. Oil CTAs — Trend Followers Pulled Back Into Longs
Oil’s renewed move higher on escalating Iran conflict has likely pulled CTAs back toward longs.
The positioning breakdown:
Model Type | Likely Oil Positioning |
|---|---|
Faster models | Covering shorts after recent pullback |
Medium-term models | Adding long exposure |
Slower models | Likely near max long already |
The prior peace-deal-driven decline likely caused faster models to flip short or reduce longs, but slower models probably reduced less exposure. Now that oil is rallying again, the systematic flow is likely buying, which reinforces the move.
This is crucial because oil is not just a commodity issue. It is feeding the entire cross-asset stress loop:
Higher Oil→Inflation Risk→Higher Yields / Rate Vol→Tighter Financial Conditions→Equity De-RiskingHigher Oil→Inflation Risk→Higher Yields / Rate Vol→Tighter Financial Conditions→Equity De-Risking
If CTAs are buying oil while also shorting Treasuries, they are mechanically reinforcing the macro pressure on equities.
6. Gold CTAs — Short Deepens as Trends Deteriorate
Gold selling has continued as price trends deteriorate. Faster and medium-term CTA models appear closer to max short, while slower models may still be adding.
The likely positioning:
Model Type | Gold Positioning |
|---|---|
Faster models | Near max short |
Medium-term models | Near max short |
Slower models | Still adding shorts |
This is notable because it runs against the structural gold bull case. The short-term technical / systematic flow is bearish even if long-term central bank, debt, and debasement themes remain supportive.
The implication is that gold can remain under tactical pressure while the USD and real yields are rising. But if real yields reverse or geopolitical stress becomes more acute in a way that overwhelms USD strength, CTA shorts could become fuel for a sharp gold rebound.
7. SPX Gamma — Buffer Has Fallen Sharply
SPX hedger gamma fell sharply this week, ending 23-Jul at US$1.4bn, which is only the 27th percentile over the past year. The decline followed the expiry of large customer short option positions in the July monthly.
This matters because positive gamma can dampen index moves. With gamma lower, the market has less dealer hedging support against larger swings.
Upcoming Expiry Risks
Next week, hedger positioning is negative in the 27-Jul expiry, where customers are long roughly 6,500 contracts near spot. That implies dealers are short options / short gamma around current levels, which can amplify intraday moves.
The 21-Aug monthly is also a notable negative contributor. Hedgers are net short around 21,000 downside contracts below 7,300.
That creates a potential instability zone below 7,300, especially if downside demand continues to build amid macro volatility.
8. Why Monthly Expiry Matters
As the August monthly expiry approaches, continued demand for downside could expand negative dealer positioning. If customers keep buying downside protection, dealers become increasingly short downside optionality. On larger selloffs, dealers may need to sell futures to hedge, exacerbating market weakness.
The risk loop is:
Customer Downside Demand→Dealer Short Gamma→Sell Futures Into Weakness→Higher Realized Vol→More Downside DemandCustomer Downside Demand→Dealer Short Gamma→Sell Futures Into Weakness→Higher Realized Vol→More Downside Demand
This is especially important if CTA thresholds are also being tested. Dealer short gamma and CTA de-risking can reinforce each other.
9. Combined Flow Risk: CTA + Gamma
The market’s vulnerability comes from the convergence of two mechanical forces:
CTA trend de-risking
Negative / reduced dealer gamma
Individually, each can matter. Together, they can create a nonlinear downside move.
The Combined Trigger Stack
Trigger | Why It Matters |
|---|---|
Nasdaq pressure | First CTA unwind wave already likely triggered |
SPX spillover | Would broaden CTA selling |
Low SPX gamma | Less dealer dampening |
Negative 27-Jul positioning | Near-term intraday instability |
Aug downside below 7,300 | Larger downside convexity risk |
Higher oil | Reinforces inflation / rates pressure |
Higher yields | Pressures long-duration equities |
Long USD | Tightens global financial conditions |
Gold CTA shorts | Reflects real-yield / USD dominance |
If NDX continues lower and SPX approaches key CTA levels while dealers are short gamma, index vol can finally catch up to the single-name and factor vol that has dominated the last several weeks.
10. Tactical Implications
Equities
The highest-risk equity index remains Nasdaq. The risk is that NDX weakness broadens into SPX and then global indices.
Preferred stance:
Stay cautious on outright NDX beta.
Use rallies to trim crowded AI / momentum exposure.
Favor relative value over index beta.
Watch SPX / NDX CTA thresholds closely.
Maintain downside convexity into earnings / Fed.
Rates
CTAs remain short Treasuries and may still add outside the front end. The trend supports higher yields for now, but position size increases the risk of a future short-covering rally.
Implication:
Higher yields remain a near-term equity headwind.
A sharp yield reversal could create relief for tech but may come with elevated volatility.
Oil
Trend followers are likely buying oil again. That reinforces the macro stress loop.
Implication:
Oil staying bid keeps pressure on Fed expectations and equity multiples.
Any geopolitical de-escalation / oil reversal would be a key risk-on catalyst.
Gold
CTA shorts are deepening. Tactical trend remains negative, but structural support remains intact.
Implication:
Gold remains vulnerable while USD and real yields rise.
If macro stress shifts from “rates higher” to “systemic risk / policy error,” gold shorts could be squeezed.
Volatility
SPX gamma is lower and downside hedging demand is growing.
Preferred expressions:
VIX call spreads
SPX put spreads
QQQ downside
SMH put spreads
Consider monetizing vol spikes if crude / rates stabilize
Nasdaq weakness has likely triggered the first wave of CTA equity unwinds, especially among aggressive stop-loss and faster-moving trend models. Broader equity positioning remains mostly intact across SPX, Russell 2000, and EURO STOXX 50, but the key risk next week is spillover. If Nasdaq pressure continues and broader indices break medium-term thresholds, CTA selling could broaden into a cross-index de-risking event.
At the same time, CTAs are aligned with the macro shock: short Treasuries, long USD, long oil, and short gold. That positioning reinforces higher yields, stronger dollar, and tighter financial conditions — all of which pressure long-duration equities.
SPX gamma has also fallen sharply to US$1.4bn, the 27th percentile over the past year, while negative hedger positioning in the 27-Jul expiry and August downside below 7,300 creates instability risk on larger moves. The combination of Nasdaq-led CTA selling, lower gamma, downside demand, and oil/rates volatility means index vol can finally catch up to the idiosyncratic volatility that has lived under the surface for weeks.
Disclaimer: The material provided is for information purposes only and should not be considered as investment advice. The views, information, or opinions expressed in the text belong solely to the author, and not to the author’s employer, organization, committee or other group or individual or company.
Past performance is not indicative of future results.
High Risk Warning: CFDs are complex instruments and come with a high risk of losing money rapidly due to leverage. 68% and 74% of retail investor accounts lose money when trading CFDs with Tickmill UK Ltd and Tickmill Europe Ltd respectively. You should consider whether you understand how CFDs work and whether you can afford to take the high risk of losing your money.
Futures and Options: Trading futures and options on margin carries a high degree of risk and may result in losses exceeding your initial investment. These products are not suitable for all investors. Ensure you fully understand the risks and take appropriate care to manage your risk.
Patrick has been involved in the financial markets for well over a decade as a self-educated professional trader and money manager. Flitting between the roles of market commentator, analyst and mentor, Patrick has improved the technical skills and psychological stance of literally hundreds of traders – coaching them to become savvy market operators!